UK Church overview
Date added: 13/07/18
Introduction
Since the publication of Religious Trends 1 in 1997, Christian Research has obtained statistics from the denominations and church groups of the United Kingdom. Each denomination compiles statistics in their own way for their own purposes, which means there are variances in definition and practice.
We have collected and summarised statistics under the following headings:
- Membership
- Congregations
- Clergy and church leaders
- Attendance
Membership
For this we use the measure that denominations use to count their closest adherents. The term ‘member’ is common among the free churches; the Anglicans have Electoral Rolls, but the Catholics prefer to count attendance at mass. Some churches may be uncomfortable with the term. In the articles and tables, we use the name a denomination uses when we can do so distinctly, but when we aggregate counts we use the description ‘membership’.
Congregations
Most denominations, etc count distinct and separate fellowships rather than buildings. There are some minor complications, such as Anglican benefices and local ecumenical projects.
Clergy and church leaders
For the most part, these are working, paid and ordained, but there are churches where this is not the model of church leadership. Again, this is not something that is a consistent indicator across the denominations.
Attendance
The only consistent measure across the denominations has been the Church Censuses conducted by Christian Research in 1979, 1989, 1998 and 2005. By no means all denominations and church groups try to collect such statistics, although more are doing go now than in the past. Again, there is no consistency, and there is in any case a variety of ways to define a measure – for example, average, a typical non-festival Sunday, those coming at least once a month.
We are generally finding that there are fewer members in proportion to attendees. This might suggest less commitment or willingness to get involved on the part of believers or it may be due in part to a more mobile society as people need to move house more often.
Other indicators
Some denominations report other statistics and we will address these in the articles below.
Overview
The end of decline?
In Religious Trends 7 and his book Pulling out of the Nosedive, Christian Research’s former director Peter Brierley made some alarming forecasts of the strength of the Christian Church by extrapolating the trends shown in the data. Whilst there was some optimism in his analysis and some slowdown of the decline in attendances, the indication was still of falling support, and these publications warned the church to act to halt and then reverse the decline. Now there are signs that the church has taken such action.
Statistics derived from a number of the major UK Christian denominations indicate that the numbers of people attending worship are now more stable than during the later years of the last millennium. These statistics contradict the widely-reported view that churchgoing numbers are in a nose-dive and the country is either becoming more secular or ‘fuzzy faithful’ – that is, that people are developing individual spiritual beliefs without joining traditional religious congregations.
Church of England
In 2000, the Church of England introduced a more structured and reliable method of gathering attendance statistics: Average Weekly and Monthly-attendance calculations are gathered in all churches on a consistent basis and are thought to give a much more realistic indication of those in church week by week.
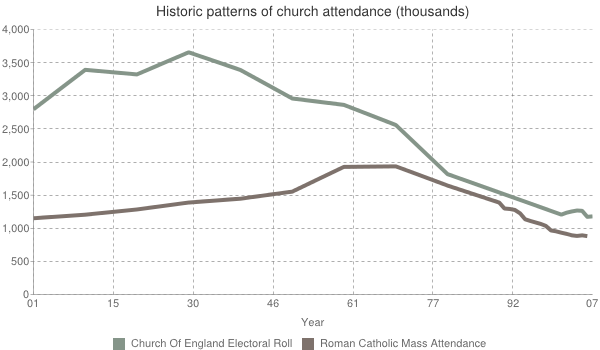
Traditionally, the Church of England has used the Electoral Roll as its main measure of support. The figure 'Historical patterns of church attendance' shows the pattern for the 20th century and compares Anglicans with the Roman Catholic church. It shows growth until the 1930s when 3,650,000 people were on Anglican rolls. Numbers then fell and continued to fall until the 1990s when the fall became less sharp.
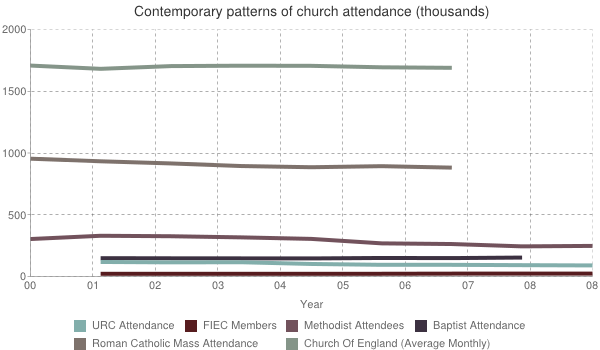
Attendance statistics at Church of England services still showed that numbers dropped off markedly during the 1980s and into the 1990s. On the basis of these figures, in the two decades to 2000, the Church of England lost around 36,000 churchgoers each year. However, the figure 'Contemporary patterns of church attendance' at shows that Church of England attendance statistics for the early part of the 21st century show relative stability.
Roman Catholic Churches
The figure 'Historical patterns of church attendance' shows that the Roman Catholic church grew during the first half of the 20th century with a burst in the 1950s to a peak in the 1960s. Since then mass attendance has fallen but the figure 'Contemporary patterns of church attendance' shows that attendances have been broadly stable since 2005. In 2008 an average of 918,844 attended Roman Catholic churches each week, up from 915,556 the year before.
The suggestion that the stabilisation of Catholic attendances is a consequence of an influx of Polish immigrants is not borne out. According to the Office for National Statistics the number of people leaving the UK for twelve months or more reached a record high in 2008 and Identity and Passport Service estimates also show that Poland was the most popular country of next residence for non-British emigrants in 2008. So, if anything, a fall in attendance in 2008 due to the Polish leaving the UK might have been expected.
Free Churches
Some trends are also shown in the figure 'Contemporary patterns of church attendance'. Christian Research has been monitoring attendances and watching the church adapt and change over recent years and there are plenty of signs to suggest that the church in this country is in reasonably good health. For example, the Baptist Union of Great Britain has seen attendances rise from 148,835 a week in 2002 to 153,714 in 2008. Christian Research has also noted that the numbers of young people going to Baptist and Anglican services was on the rise, challenging fears that demographic trends would have an adverse effect on future church attendance.
Church attendances are, of course, just one rather crude measure of the impact of churches on the communities they serve. In 2009, attendances at Methodist churches rose slightly (+1%) compared with 2008 and the data also reveal that excellent new work is going on – for example, there are well over 500 thriving ‘fresh expressions’ of church attached to Methodist churches in Great Britain. Work with young people is also flourishing: around 100,000 young people attend groups run by, or with, Methodist churches and midweek children’s activities in churches attract two more under 13 year olds for every three present on a Sunday. The statistics also reveal that the Methodist Church has a pastoral role in the lives of well over half a million people in Britain.
Other churches shown in the figure 'Contemporary patterns of church attendance' are the United Reformed Church, which continues to report falls in membership and attendance and the Fellowship of Evangelical Churches which has been growing steadily in support for some years and continues to do so.
Christian Research does not yet have reliable figures for enough Pentecostal churches to establish a more recent pattern, but for Religious Trends 7, this was a growing sector of the church, especially among black majority churches.
At long last it looks as if we may be reaching the end of decline for church attendance in the UK. This information should help to reposition church within the minds of Christians, churches and the rest of society.
Back